These photos are from a game we played in class called 'Stop Disasters' which can be found here:
This game allows players to save (or destroy) their given city which, unfortunately, is located in an area with a hazard on the way! You are allotted a certain amount of time to develop as many preventative measures as possible to protect the people and structures within your city.
You can choose which type of hazardous event you wish to be stuck upon your city, anything from wildfires, to a flood, to a tsunami. You can also choose how difficult you want the game to be, so giving you more city and people to protect.
These images are from three scenarios I played out. Two of them I planned strategically, and one I tried to cause as much destruction as possible:
This first scenario was a small coastal village with a Tsunami on the way... 
This image shows most of the buildings I constructed to provide defense against the incoming tsunami. All of my structures are away from the coast line so that they have the least probability of being affected by the wave. The housing with orange roofing are concrete and have deep foundations, thus providing strong protection against the impact. The village school and hospital are located at the upper left corner. Both are far from the coast and have reinforced foundations. These two places, along with the community center (the yellow-orange building near the left center), all provide the community with a safe place to go as well as information in how to react in the case of a tsunami. The community center is also connected to a seismic reader which is located in the ocean. If the reader picks up movement from a coming tsunami, it will alert the village so they have plenty of time to evacuate the area or find shelter.

This image shows some of the defensive structures I constructed to further protect the area from the wave. Sand dunes, palm trees, and mangrove trees all provide a natural way to defend against tsunami waves. Forestation and mangrove planting are especially good because they also create new habitats for various species.

I got a metal!
The second scenario I played out was a populated arid area with a wild fire on the way...

This image shows the location of the town's hospital, a few of the houses, the mining building, and the water tower. The water tower is a huge asset to the town, as is the mining building for jobs. I protected all of these structures with fire-resistant trees that hold in moisture, and cleared dry trees, brush, and dry bushes from the area so there was no chance stay sparks from the wild fire could catch and damage these buildings. The rocks are a natural fire break that I chose to utilize.

This image shows some more housing, the school, and community center, all free from dry brush and surrounded with fire resistant trees. I made sure all the housing in the area had metal roofing, the electrical units protected, and the brush swept away from their house. The community center and school both provided information and an alert system for when the fire way leering. These mitigation efforts all allowed the housing to be unaffected when the fire played out.

Burn baby burn! I ended up not getting a metal for this scenario. There was too much damage done despite the fact that I spent all but $10 clearing dry trees and grass and reinforcing my structures with metal roofing.
For my final scenario, I chose to do the tsunami simulation again. I tried to be as destructive as I could! |

As you can see here, I've placed the hotels right along the coast line. Unfortunately, this is a very common place for hotels to be located because the view of the ocean attracts tourists. Though the view is lovely, the vulnerability of the structures, and the people within them, is very high. I also placed the hospital and school in a risky location.

Here are more hotel condos as well as local housing. The bamboo housing right on the coast is a natural and cheap material to build with, however it provides very low protection against a tsunami event. Locals also tend to place their homes in poor locations because they seek the view of the ocean.

Tsunami. Takin names left and right.

This was the former location of the hotels. Yikes!
Case study considering one type of environmental hazard in relationship to how geotechnology and the engineering paradigm can be useful to mitigation efforts:
 The engineering paradigm is in use for this data on Historical Midwest Tornados.
The National Weather Service Storm Predicition Center's technology to map where tornados have touched down.
The Fujita Scale is a numeric scale that measures wind speed and destructive power of tornados. The Fujita Scale ranges from F0 (40-72mph) to F5 (261-318mph).
To have a complexity paradigm based approached, information on the socio-economic status of these areas and how people were affected would need to be added.
In relevance to the drought throughout the US and many other parts of the world, we did a case study examining the relationship between crop yields and drought severity within the United States: This image shows the severity of the drought in the US according to the Palmer Drought Severity Index. As you can see, the worst part of the drought takes place in the central US.
 This image shows the severity of the drought in the US according to the Palmer Drought Severity Index. As you can see, the worst part of the drought takes place in the central US.
This image shows the current crop yields for the US according to calories produced. Areas most affected by the drought are also areas that have a large crop yield, which has a devistating effect for farmers in these areas.

Mollisols is soil type that allows for great crop growth because it holds moisture well. However, if the drought lasts too long, this soil could lose its nutricious values and become dried out, thus making it unuseable for farming.
For this lab, we did a study on earthquakes in the United States. We focused in on an area called North Ridge in CA. The most vulnerable areas are made of quaternary rocks, which are very young and unstable in relationship to the age of many other earth rocks because they are unconsolidated material.
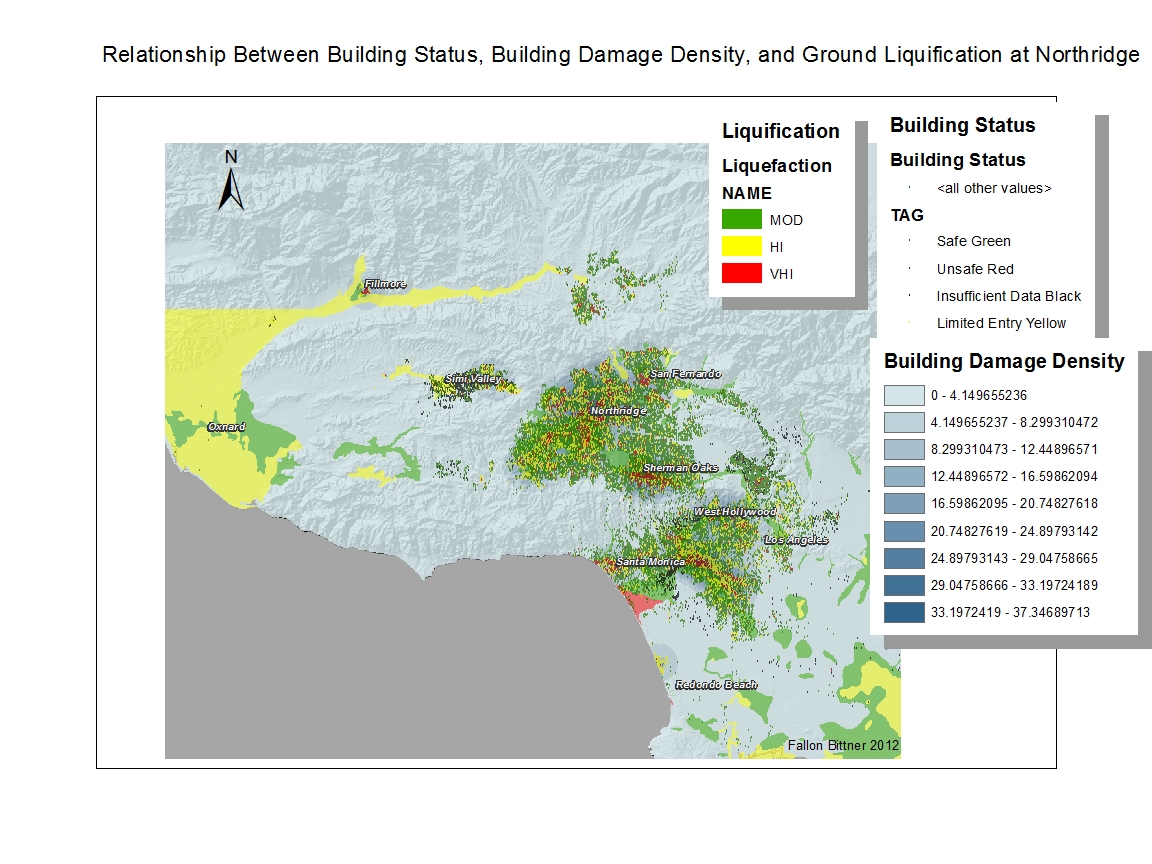
In this image, though it is hard to see, you can notice that there is a direct correlation with high soil liquification, unsafe red buildings, and high building damage density.
 |
| This image shows the direct correlation between high peak ground acceleration and a high building damage density. |

This image shows the direct correlation between peak ground velocity and building damage density.

This image shows the entire US and areas that experience earthquakes. The colorful parts represent acceleration values while the light purple/blue color indicate areas with high quaternary rock deposits...

As you can see, the areas with high incidence and susceptibility to landslides directly correlate to the quaternary deposits in the above map.
This next lab we did considered volcanos and all the disastrous things that can come along with it. Much of the population thinks of volcanos as simply spitting or oozing out lava, but that is not the case by any means. Volcanos are capable of much more: mudslides from volcanic ash can wipe out cities, or in the case of Mount St. Helens, tons of energy can build up and blast half of a mountain away.
For the first part of this lab, we took a look at the world's volcanos and the "Ring of Fire." We then used ArcGIS to determine the countries with the most active volcanos: Indonesia, Japan, United States, Russia, and Italy all have at least one boarder along a tectonic plate boundary.

(The orange and brown suggest the lahar flow)


Finally, we looked at Mount St. Helens and the volume the mountain lost during its explosion in May 1980. The total volume lost was 3,900,000,000 cubic yards. WOWZA


The image on the left shows MSH before the explosion, and the image on the right shows the after.

Case study on mass wastage:
 |
| This image illustrates a map that could be used in a lawsuit against developers for building homes in a hazard prone area. This is Snow Creek in Forest Falls, CA. In July 1991 a large mudflow caused a ton of damage after a large amout of rain. The large green area starting at the bottom of the image, extending northward is the path of the mudflow in this area. The red parcels, showing the most damage, are in the path of this flow. Another area that was damaged the most was near the river itself. This area was at risk because the slopes get very steep down into the valley where the most damage was done. |
This lab was especially fun to do. We simulated a flood at UW-Eau Claire that would potentially do some serious damage to the greater campus area, which all happens to be located on the flood plain.
This lab also was to clear up some confusion with the term '100 year flood'. Though whoever thought of the term didn't quite think it through completely, it does NOT mean this sort of flood will happen every 100 years. It actually means there is a 1% chance of it happening EACH year. The 100 is not years, but instead the denominator of an equation: 1/100 = .01
Boo to the person who decided to call it such a term.
Anyways, onto the flooding. We began by modeling a 1% flood, which would mean water levels would be 780 feet above sea level. Then we modeled at 790 and 800 feet above sea level. To be concise, I composed all the models into one:

The purple symbolizes the 1% chance flood. The green is an addition to the purple flood waters, and the blue is another addition. So, in the case of a 800ft ASL flood, this entire highlighted area would be covered in water.
For the second part, we zoomed in and created a 3D model of the campus area and did the same simulation:

We took a complexity based approach when looking at this case study, and we considered the population of the area we were looking at, such as ages and households.
First we looked at a tsunami that occurred at Oxnard in 1812... 

And then the storm surge level of a category 3 hurricane at Naples, Florida...

The point of this study was to show that despite the risks that living along a coast holds, people keep a blind eye to it. At Oxnard, emergency and education buildings were at serious risk from the tsunami when smart planning when the area was built could have kept these critical areas safe. People need a safe house to go to if an event is to occur, but if these places are at risk too, what good is it doing?
As for Naples, people continue to live and build their homes there despite the risk of the storm surge from a hurricane. The people would rather have a beautiful view of the coast and ocean without considering the risk they are putting themselves into or the money they will need to spend fixing their homes when an event does happen.
Isn't technology lovely?
No comments:
Post a Comment